Making Amplification Measurable
Jonathan Stray, Luke Thorburn, Priyanjana Bengani / Apr 28, 2023Luke Thorburn is a doctoral researcher in safe and trusted AI at King’s College London; Jonathan Stray is a Senior Scientist at The Center for Human-Compatible Artificial Intelligence (CHAI), Berkeley; and Priyanjana Bengani is a Senior Research Fellow at the Tow Center for Digital Journalism at Columbia University.


The term “amplification” is ubiquitous in discussions of recommender systems and even legislation, but is not well-defined. We have previously argued that the term is too ambiguous to be used in law, and that the three most common interpretations — comparison with a counterfactual baseline algorithm, mere distribution, or a lack of user agency — are either difficult to justify, or difficult to measure consistently. That said, the way recommender systems are designed does influence how widely different types of content are distributed. Amplification is an evocative term to describe this reality, and remains a prominent subject of research. For these reasons, it would be useful to have a common understanding of what amplification is and how to measure it.
In this piece, we propose five properties that measures of amplification should have if they are to be useful in discussions of recommender policy. Specifically, they should: (1) define the content of interest, (2) define an appropriate baseline, (3) focus on impressions as the relevant outcome, (4) isolate the effect of the algorithm from that of human behavior, and (5) specify the time horizon over which they apply. The first three properties are relatively easy to satisfy, while the latter involve causal inference and systemic equilibria, and pose greater challenges. A measure that satisfies these properties can be said to measure relative algorithmic amplification.
relative algorithmic amplification: A change in the distribution under one algorithm as compared to an alternative algorithm, holding user behavior constant.
We think that this definition is both clarifying and useful, and that, as a research community, our goal should be to develop measures of relative algorithmic amplification which satisfy each of the above conditions. We discuss each in more detail below.
Easy-ish Properties
1. Content
When measuring amplification we first need to answer the question: amplification of what? There are many types of content for which we might be interested in measuring amplification, such as conspiracy theories, false news, posts with a certain political slant or those with morally-charged language.
However, none of these descriptions is enough, by itself, to define what content is in scope. For example, the amount of “fake news” varies greatly depending on how it’s defined. So, attempts to measure amplification should be transparent and precise about how content was identified as in-scope. For example, if the content was identified manually, what were the instructions given to human raters? What was their inter-rater reliability? Sometimes, content is identified using hashtags, key words, or seed accounts, which may or may not capture the sense of broad categories like “conspiracy” or “extreme,” which may themselves be contested terms. Or, if the content was identified using a classification algorithm, what data was it trained on? How accurate was the classification as compared to human raters, and what trade-offs does it create between false positives and false negatives? For the most part, studies on amplification already document such information.
2. Baseline
When measuring amplification we need to answer the question: amplified relative to what? The claim that content has been amplified implies a counterfactual scenario in which, had the algorithm been designed differently, the content would not have been distributed so widely. There are many baseline algorithms which might serve as useful benchmarks, depending on the context. These include reverse chronological feeds, a feed of randomly selected items, or a previous version of the recommender system.
Attempts to measure amplification should be transparent and precise about which alternative recommendation algorithm they are using as a baseline. There is no universally “correct” or “neutral” baseline — can you really say, quantitatively, how many people should see any particular item? — although certain baselines might be better or worse comparisons. Indeed, it is probably more useful to compare amplification under multiple (i.e., more than two) candidate algorithms. Currently, some discussions of amplification do specify a baseline, but others do not.
3. Outcome
Third, when measuring amplification we need to specify what it is that amplification increases. The main two candidates are impressions (that is, the number of times the content was seen) and engagement (that is, reactions such as the number of times the content was liked or shared).
Of these, we think measures of amplification should use impressions as the outcome variable. Arguably, impressions do a better job of characterizing the algorithm (people usually have little control over the specific posts which appear in their feed), whereas other engagement measures better reflect user behavior. It matters if content is shown, regardless of whether the user explicitly reacted to it.
Difficult-ish Properties
4. Algorithm v. User Behavior
We are interested in measures of amplification that distinguish the contribution of the recommender from that of user behavior. If posts from the purple party receive a relatively large number of impressions, is that because the algorithm is biased towards the purple party, or because people tend to engage more with purple party content?
We are not dismissing the role of human behavior. The ways and degree to which human behavior and psychology contribute to the spread of certain types of content is an important research question. But in the context of recommender policy discussions, we are interested in understanding the effect of varying the algorithm, because that is where platforms and regulators have the most control.
Fundamentally, this is a problem of causal inference. We would like to know: if we change the algorithm but “hold user behavior constant”, what will be the effect on impressions? When thinking about questions of causality, it is helpful to draw simple graphs which represent whether different variables influence one another. For example, here is one possible causal model of amplification.
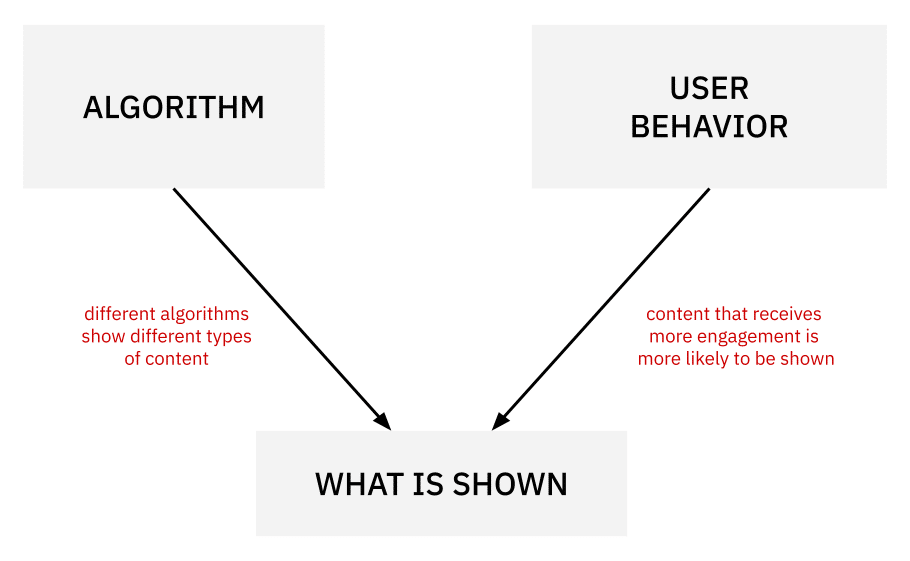
In this model, both user behavior and the choice of algorithm affect what is shown. There are no other arrows, so it is assumed in this model that there are no other direct causal relationships between these variables. If this simplistic model was accurate, then it would be relatively easy to distinguish the effect of the algorithm from that of user behavior. One could simply sequentially try out different algorithms and observe the change in what is shown. The pair of converging arrows — often referred to as a collider or “v-structure” — is a standard situation in causal inference.
Unfortunately, reality is not that simple. A more accurate causal graph would look something like this:
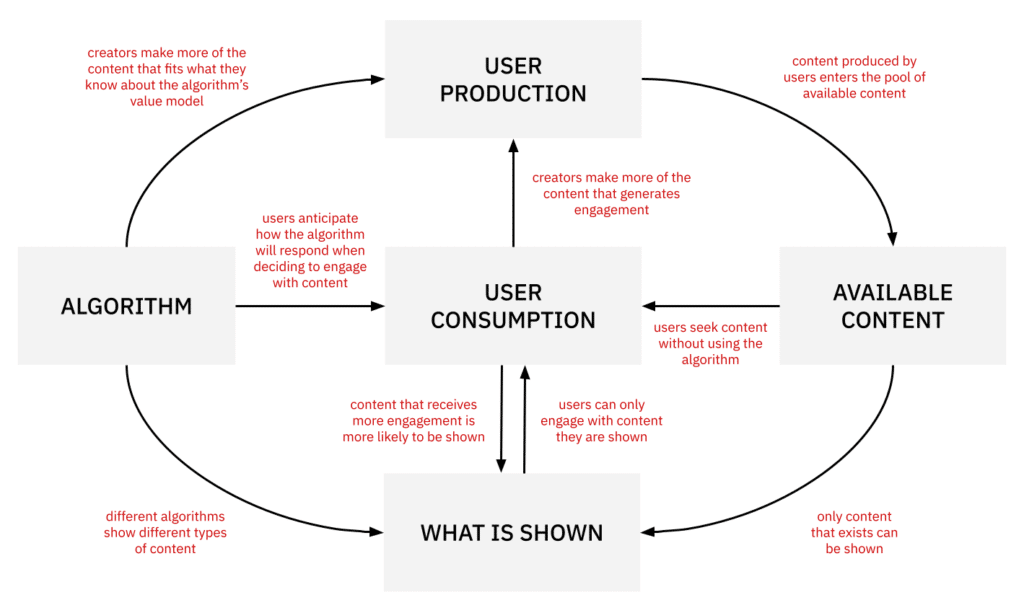
In this model, it is no longer straightforward to tease apart the effect of the algorithm from that of user behavior — both producers and consumers of content. This is because changing the algorithm will also cause user behavior to change: users develop an intuition for how the algorithm works, and their preferences may be influenced by the content they are shown. In addition, this model has three closed loops, which makes it trickier to do causal inference. Arguably, this model is still too simplistic and misses core aspects of reality such as external cultural norms, the decisions made by competing platforms, or inauthentic forms of engagement such as astroturfing.
This is not to say that distinguishing the contribution of the algorithm from that of user behavior is impossible, only that it is difficult. Strategies which can help include (1) on-platform experiments or A/B tests to compare two algorithms, (2) stipulating that research participants engage in a predetermined manner to prevent user behavior from being affected by other variables (e.g., “always click on the third recommended video”), and (3) removing loops by distinguishing between variables measured at different points in time.
5. Equilibrium Effects
Finally, attempts to measure amplification should specify the time horizon over which they apply. When a new recommender algorithm is introduced, other actors — users, journalists, editors, politicians, content creators, competing platforms, foreign governments — all respond by changing their behavior, and it takes time for these changes to play out. In some experiments, users have taken 3-6 months to adapt. Relative algorithmic amplification is effectively a prediction about what will happen to impressions if you change from one algorithm to another, so it is important that it is clear about the time period over which this change is expected.
By analogy, consider a shoe manufacturer who starts making sneakers with an innovative new design and wants to measure how this decision affected its revenue. If the new design is popular, there might be an initial increase in revenue as consumers — who would otherwise have bought their shoes elsewhere — purchase the new design. This is the short run, non-equilibrium effect. But as time progresses, all the people who like the design will have likely bought it, the design might become mainstream and seem less cool, and rival firms might introduce similar sneakers which directly compete. After all these changes wash out, the sneaker market reaches a new equilibrium. The corresponding long run, equilibrium effect on the annual revenue of the firm might be quite different to the short run effect of introducing the new design.
When a platform changes its recommender algorithm, there are similar dynamics at play. Producers of content strategically adapt the style of content they produce to attract attention in the new regime. (For example, when Facebook reduced the visibility of sensationalistic posts about health and politics, some publishers started posting more sensationalistic posts about crime, and lay users commonly learn to use euphemisms and codewords to avoid having the visibility of their posts restricted.) There are saturation effects as users’ appetite for certain types of content becomes satiated, rival platforms who change their own product to compete, decisions by some users to switch platforms, and network effects that can accelerate or hamper changing levels of engagement.
Comparing the long run, equilibrium effects of different recommender algorithms is really hard, and perhaps impossible to do perfectly. Because the world is so interconnected, it is not possible to completely isolate an experimental control group. A platform could trial a new recommender system with, say, 50% of its users, but those users still interact with everyone else, so the effects of using the new algorithm may cause changes to and “contaminate” the baseline against which the platform is trying to measure the impact of the new recommender. There are methods that can help (e.g. trialing algorithms in one country at a time, and maintaining a long term control group like the 1% of Twitter users who have only ever had a chronological feed), but they are not perfect solutions. It is also debatable whether a long run equilibrium is ever reached in the context of constantly evolving mass communication.
It may be that we can only estimate the short run, non-equilibrium effects of algorithmic changes. This is analogous to an elasticity in economics. In any case, it is important that measures of amplification are transparent about the time horizon over which they apply.
A Realistic Definition
Research on amplification has been held back by a lack of consistent definitions, and a corresponding shortage of practical metrics. In part, this is because “amplification” involves many moving pieces. We propose relative algorithmic amplification to emphasize the need to choose a baseline (relative) and factor out user behavior (algorithmic).
This definition has the great advantage of being clear about what the quantity to be measured actually is. But as the above discussion shows, that doesn’t mean it’s easy to measure. If “amplification” is something different from “distribution” we need to answer “amplified compared to what?” And if we want to use “amplification” to understand the effect of algorithm design, we need to be able to separate it somehow from user behavior, both in the short run and the long run. It may seem that our preferred definition brings in a lot of complexity – but this is a feature, not a bug. Amplification is an inherently complex idea, so it’s better that we use a definition that tells us where the difficulties lie.